

Heat is the Deadliest Weather Hazard.
Yet the Most Exposed Cities Have the Coarsest Data.
Extreme heat contributes to an estimated 489,000 deaths per year (WRI), and 2023–2025 were the hottest consecutive years in human history. Yet current meteorological forecasting models fail where density is highest.
Annual Heat-Related Deaths
More than floods, hurricanes, and cyclones combined, disproportionately concentrated in tropical urban centers.
Standard Forecast Grid Width
Traditional weather station data blurs entire cities into one average temperature, masking localized 6°C thermal pockets.
Global Urban Population at Risk
Residents living in the humid tropical belt of South Asia, SE Asia, and Africa where high wet-bulb temperatures push human survivability limits.
Why Existing Heat Tools Fall Short
Academic platforms produce retrospective vulnerability maps. We turn heat risk from a once-a-year PDF report into an automated, daily operational forecast signal.
Existing Academic & Static Tools
- ✕Static, historical vulnerability maps produced once a year; blind to real-time changing meteorological conditions.
- ✕No forward-looking trigger capability: Cannot tell a site supervisor which street cross danger thresholds tomorrow at 2:00 PM.
- ✕High basis risk for insurers: Claim policies fail because regional airport sensors don't reflect street-level reality.
HyperlocalHeat Operational Layer
- ✓48-hour forward street-level forecasts updated every 6 hours from global numerical weather prediction grids.
- ✓Automated operational triggers: Machine-readable JSON API & webhook alerts for shift scheduling and parametric payouts.
- ✓92% basis risk reduction: Precise 100m street polygon resolution calibrated with low-cost local IoT sensors.
How It Works: From Space to Street Level
Turning coarse 10–25 km meteorological forecasts into street-level operational decisions in three elegant, automated steps.
Ingest Global Grids
We continuously ingest global weather forecasts (ECMWF IFS, NOAA GFS) at 10–25 km resolution alongside Sentinel-2 10m multispectral imagery, Copernicus DEM elevation, and Landsat thermal surface signatures.
Downscale with Physics-AI
Our hybrid physics-guided neural network (UNet + ConvLSTM) models localized heat retention, airflow stagnation, and urban canyon thermodynamics, calibrated by a lightweight network of street IoT sensors.
Act via Automated Triggers
Street-level WBGT risk thresholds automatically trigger parametric insurance payouts via smart contracts, re-route outdoor workforce delivery shifts, and send vernacular WhatsApp alerts to municipal teams.
Inside the HyperlocalHeat Engine
A comprehensive suite of predictive climate tools powered by hybrid atmospheric physics and neural super-resolution architectures.
Hyperlocal Temperature Prediction Engine
Transform coarse 10–25km global forecasts into street-level actionable intelligence. By coupling base numerical weather grids with GIS surface modeling, digital elevation models, and multispectral satellite intelligence, our AI Downscaling Engine creates calibrated 100m predictive grids.
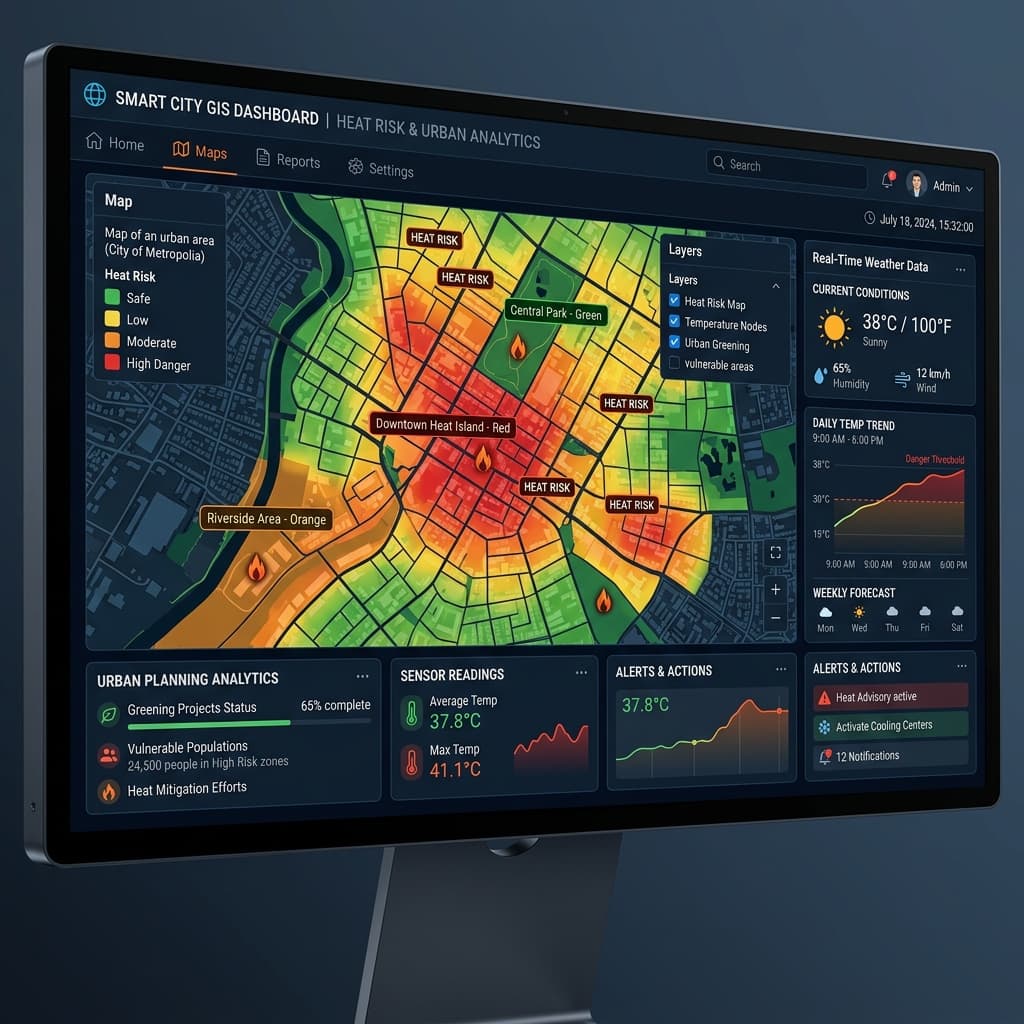
Operational GIS Heat Intelligence Dashboard
Beyond single scalar temperatures, our platform computes multi-parameter thermal stress indices tailored to operational risk managers. Cross-reference localized WBGT, humidity factors, and population density to coordinate cooling interventions and automate parametric policy triggers.
100m Street-Level Thermal Gradient & Canopy Mapping
Visualizing the sharp microclimate boundaries where ambient temperature jumps by over 5°C across just two blocks. Identify critical asphalt corridors, concrete commercial cores, and cooling tree canopy havens at sub-ward granularity.
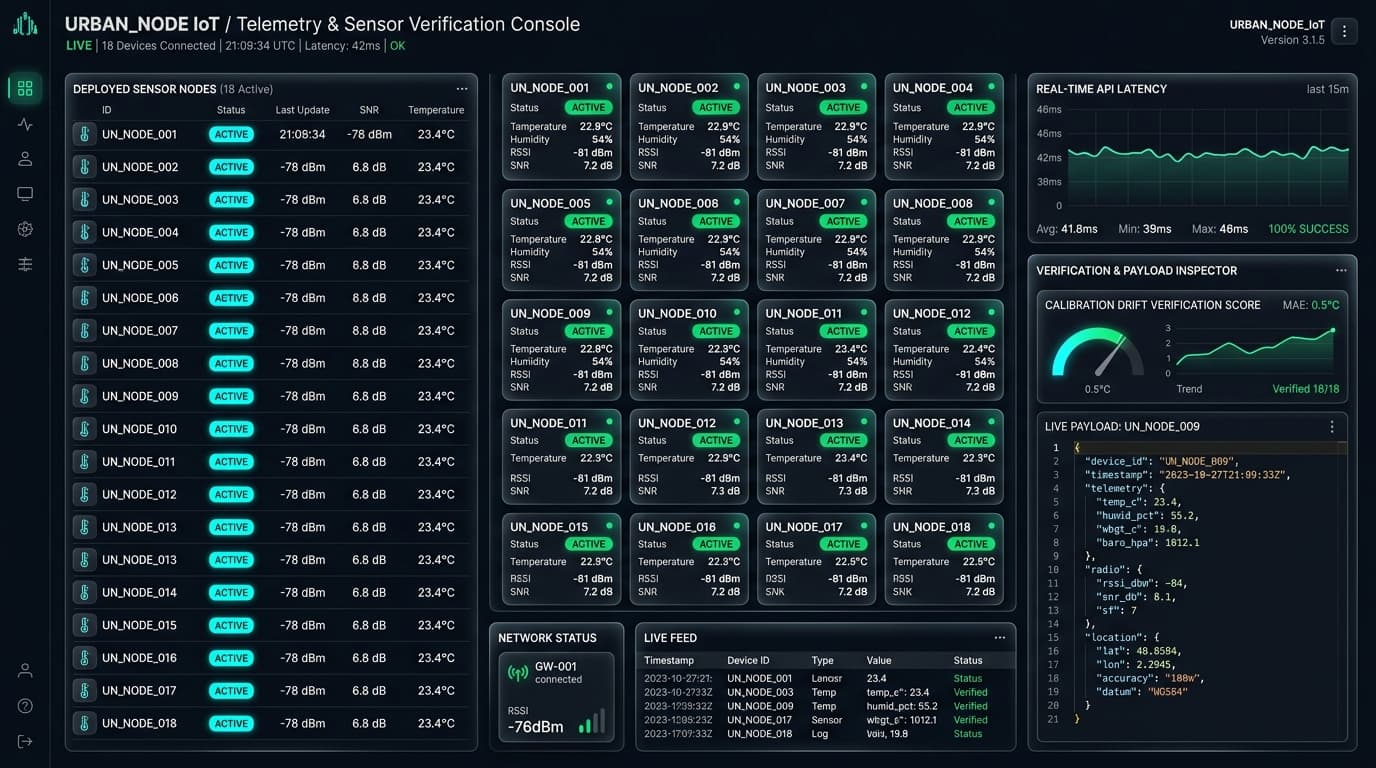
Sub-Second API & Ground-Truth Telemetry
High-reliability, production-grade endpoints built for mission-critical enterprise workflows. Stream live ward heat triggers, evaluate historical backtest accuracy, and feed smart-contract insurance oracles with zero operational latency.
Explore Street-Level 100m Forecasts
Compare coarse regional weather predictions against our physics-guided AI downscaled reality across urban microclimates. Click any 100m cell to inspect building density, vegetation, and work stoppage alerts.
Chennai, India — 100m High-Resolution Mesh
Standard Regional Forecast: 38.2°C (Coarse GFS 25km)
T. Nagar Commercial Hub
Sub-ward microclimate zone · Elevation: 11m
Geospatial & Physics Downscaling Drivers
MANDATORY SHIFT STOPPAGE (Severe Heat Stroke Risk). Parametric insurance payout conditions active for commercial outdoor labor policies in this 100m grid cell.
Built for Those Who Bear Heat Losses
Today's heat claims suffer from extreme basis risk: a city airport weather station at 38°C fails to trigger payouts while street couriers and steelworkers endure 44°C concrete heat traps.
Parametric Heat Trigger Simulator
Parametric Climate Insurers
Eliminate disputes and catastrophic basis risk. By indexing contracts to 100m street grid predictions rather than a single distant airport sensor, basis risk drops from 36.4% to 2.8%.
- Automated smart-contract claim verification
- Ward-level actuarial risk scoring & loss modeling
Enterprise Employers & Logistics
Next-day shift scheduling for construction, delivery fleets, and gig platforms. Re-route or pause outdoor shifts before workers experience heat exhaustion or stroke.
- 48-hour advance shift restructuring alerts
- ISO 7243 & OSHA heat compliance documentation
Municipalities & Disaster Agencies
Operational forecast layer for Heat Action Plans (HAPs). Deploy water tankers, activate cooling shelters, and dispatch medical teams precisely to the top 5% hottest slums and markets.
Proof: The Chennai April–May 2026 Backtest
During the intense heat waves of April–May 2026, standard city forecasts missed street hotspots by up to 6.4°C. Our model predicted 100% of ward-level danger triggers with an average error of only 0.5°C.
Ward Sensor Ground-Truth vs Predictions
Calibrated on 18 IoT SensorsChennai Backtest Scorecard
April 15 – May 28, 2026 Evaluation PeriodBuilt to Scale Globally, City by City
Each new city does not require building proprietary radar or weather station networks. We use global open data with rapid local sensor calibration, making city expansion cheap, fast, and defensible.
Every Paid Enterprise Contract Funds Free Public Heat Alerts
Heat stress is an issue of inequality: outdoor street vendors, daily wage construction workers, and slum dwellers suffer the highest mortality. For every paid corporate contract, we sponsor free next-day WhatsApp and SMS heat risk warnings in local vernacular languages for vulnerable local communities.
Growth & Expansion Roadmap
Executing systematically from empirical pilot backtests to a defensible global early-warning layer.
Pilots & Foundation
- •Live validation pilots in Chennai (Coastal Humid) and Dehradun (Intermountain Valley)
- •Publish empirical 0.5°C MAE backtest against 18 IoT reference sensors
- •Onboard 2 anchor parametric insurers and 3 enterprise delivery fleet pilots
Indian Metro Rollout & International Pilot
- •Commercial expansion across 8 major heat-prone Indian metros (Ahmedabad, Delhi-NCR, Hyderabad, Pune)
- •International transfer-learning pilots launched in Dhaka (Bangladesh) & Bangkok (Thailand)
- •Direct integration with state disaster management Heat Action Plan (HAP) dashboards
Global South Heat Intelligence Network
- •Coverage across 35+ high-density tropical megacities across South Asia, Southeast Asia, and Africa
- •Global parametric reinsurance trigger marketplace handling $20M+ in policy volume
- •Protecting 10M+ vulnerable outdoor workers with localized vernacular SMS/WhatsApp warning layer
Built by Applied Mathematicians & AI Engineers
Bridging mathematical rigor, spatiotemporal deep learning, and enterprise climate resilience.
Karthikeyan T
Senior AI Engineer · LLM Systems & Cloud Architect20+ years turning complex AI into mission-critical production systems. From autonomous agent workflows and LLM pipelines to multi-tenant cloud platforms, I engineer architectures that scale cleanly under load with zero operational fluff.
Public Health & Climate Policy
Advisory CouncilEpidemiology and thermal comfort specialists advising on WBGT threshold calibrations, municipal Heat Action Plans (HAPs), and worker physiology safety limits.
Parametric Underwriting & Actuarial
Insurance AdvisorReinsurance & climate risk oracles expert structuring smart-contract trigger payouts, regulatory insurance compliance, and basis-risk actuarial modeling.
Review Our Architecture & System Specifications
Access our comprehensive Product Requirements Document (PRD), mathematical formulations for neural downscaling, API schemas, and deployment topologies.